Knowing When a Bigger Model Helps: A Capacity Ladder for Cross-Family Microbial Trait Prediction
When is a bigger model worth it? Climb a capacity ladder of simple readouts on frozen ESM-2 embeddings until they plateau, then escalate only if an independent coverage ceiling beats the plateau. For most cross-family traits, capacity is not the bottleneck.
Abstract
Recent microbial phenotype predictors often place architectural emphasis on genome-level pooling or encoder adaptation. A simpler alternative is to treat a pretrained protein language model as a frozen feature extractor and fit a regularized downstream model. We test this baseline family on frozen ESM-2 genome embeddings under the same family-held-out split used in our prior cross-clade studies. On three representative binary traits (catalase, motility, sporulation), simple readouts are already strong: a soft-vote ensemble reaches mean AUROC 0.824 and mean macro-F1 0.736, and the strongest single models (regularized random forest, histogram gradient boosting, and L2 logistic regression at PCA rank 25) are within a hair of it.
The PCA rank sweep is especially informative: rank 25 generally outperforms rank 6, arguing against a perturbation-style "six-dimensional" explanation for these microbial traits. The result reframes our earlier pooling and LoRA findings: frozen ESM-2 already contains substantial recoverable trait signal, so the remaining family-shift failure is more likely due to cross-clade coverage, label sparsity and noise, and trait biology than to a missing high-capacity encoder update.
The baseline we had skipped
Two earlier experiments isolated architectural levers in genome-to-phenotype prediction. The first asked whether learned pooling over protein embeddings beats mean pooling; the advantage was trait-dependent in-distribution and collapsed under family-held-out evaluation. The second asked whether adapting ESM-2 with LoRA recovers the lost transfer signal; the answer was again negative once imbalanced-label metric artifacts were removed.
A natural critique of both is that they skipped an important baseline: simple downstream models on frozen embeddings. In many applied biological pipelines a heavy upstream representation model produces rich features, and a smaller downstream classifier extracts the task-specific signal. If the embedding already contains the relevant information, then fine-tuning the encoder may add cost and overfitting risk without improving generalization. This note tests that critique directly.
A family of simple readouts
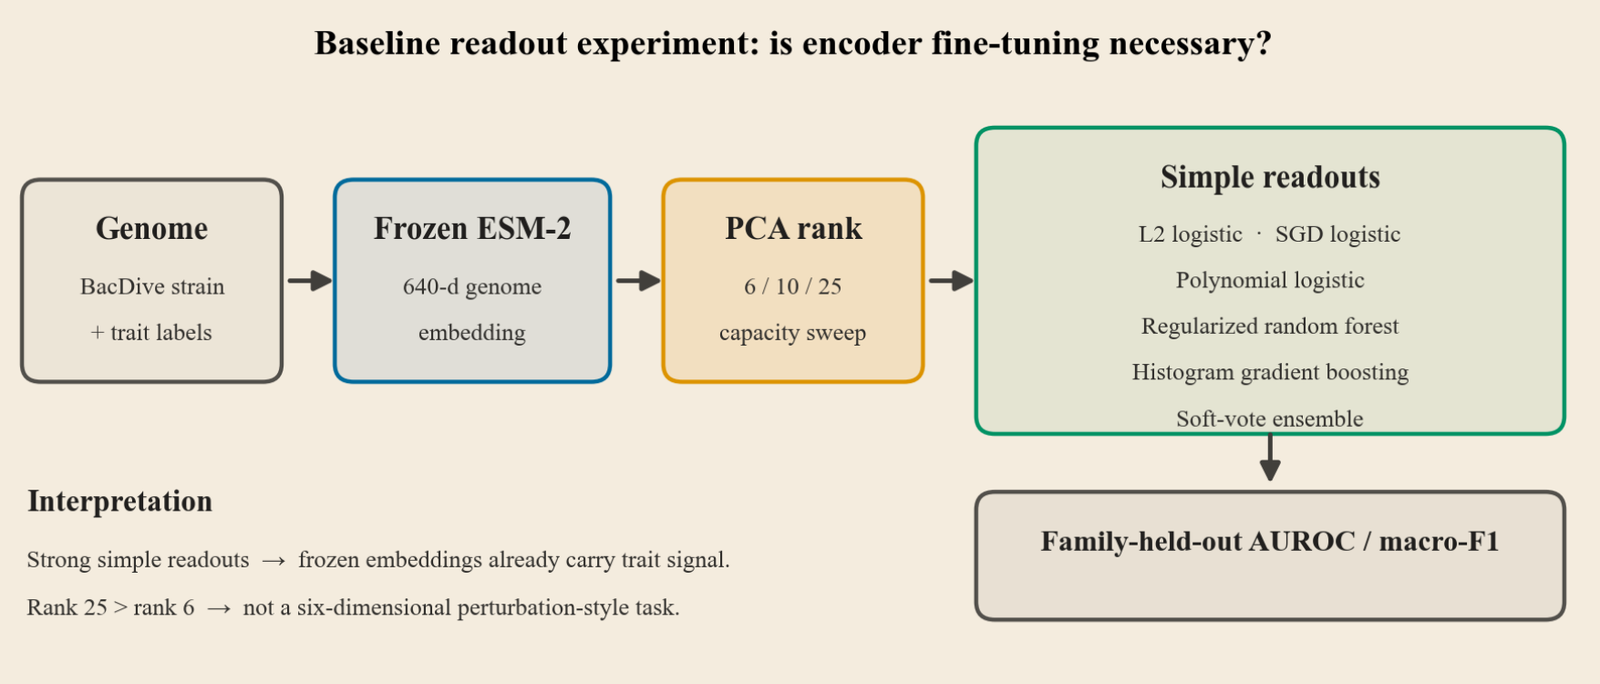
We keep ESM-2 frozen, compress the genome embeddings to several PCA ranks (6, 10, 25), and fit a family of simple readouts on the same family-held-out split: L2 logistic regression, an SGD-trained logistic classifier, degree-2 polynomial logistic regression, a regularized random forest, histogram gradient boosting, and a fixed soft-vote ensemble. Rank 6 is included because low-rank perturbation benchmarks in single-cell modeling have been criticized for containing only a handful of effective dimensions; rank 25 tests whether microbial trait signal needs a broader subspace. We report AUROC (threshold-free ranking quality) and macro-F1 (which weights both classes equally, important for imbalanced biological labels).
Simple readouts are competitive models
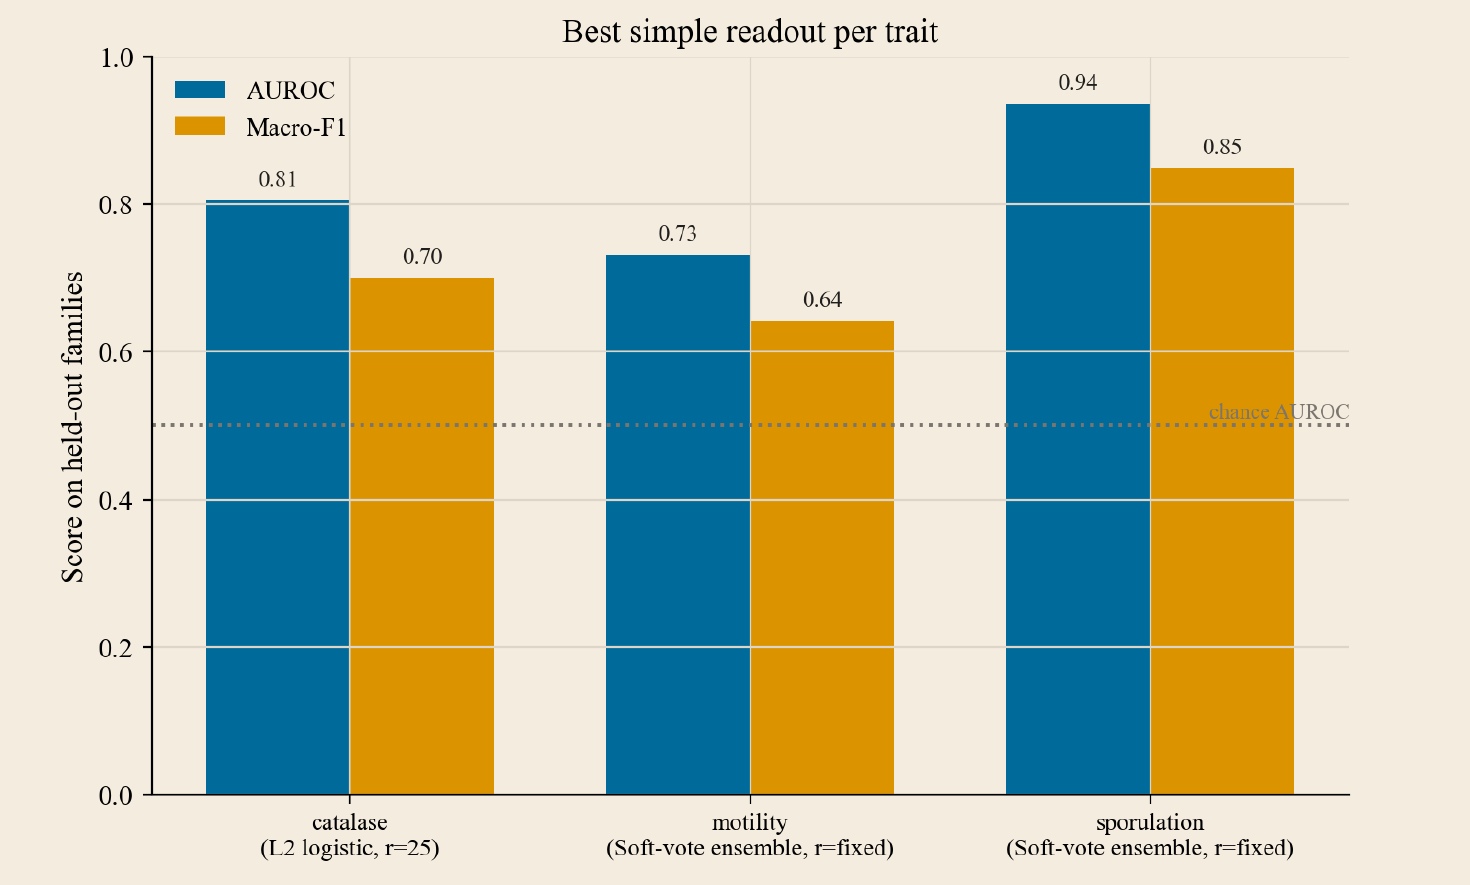
These are not weak controls. The most striking single result is sporulation: a simple ensemble over frozen embeddings reaches AUROC 0.936 and macro-F1 0.848 on held-out families; the ESM-2 embedding already exposes a strong sporulation signal to lightweight readouts. Catalase is strongly ranked by L2 logistic regression (AUROC 0.805), and motility, the hardest of the three, still clears chance.
| Model | Rank | Mean macro-F1 | Mean AUROC | Mean AUPRC |
|---|---|---|---|---|
| Soft-vote ensemble | fixed | 0.736 | 0.824 | 0.795 |
| Regularized random forest | 25 | 0.724 | 0.803 | 0.765 |
| Histogram gradient boosting | 25 | 0.717 | 0.803 | 0.768 |
| L2 logistic regression | 25 | 0.713 | 0.808 | 0.759 |
| Polynomial logistic | 25 | 0.698 | 0.776 | 0.726 |
| SGD logistic | 25 | 0.671 | 0.761 | 0.720 |
Three single-model baselines are close: L2 logistic regression, regularized random forest, and histogram gradient boosting. The logistic result says much of the signal is almost linearly recoverable from frozen ESM-2; the tree results say there are useful nonlinear interactions that do not require a deep downstream architecture. Polynomial logistic is competitive but not best, suggesting "all pairwise interactions" is not the right inductive bias by itself, and the SGD classifier is the weakest, a reminder that optimizer and regularization details matter even for simple readouts.
Rank 25 beats rank 6
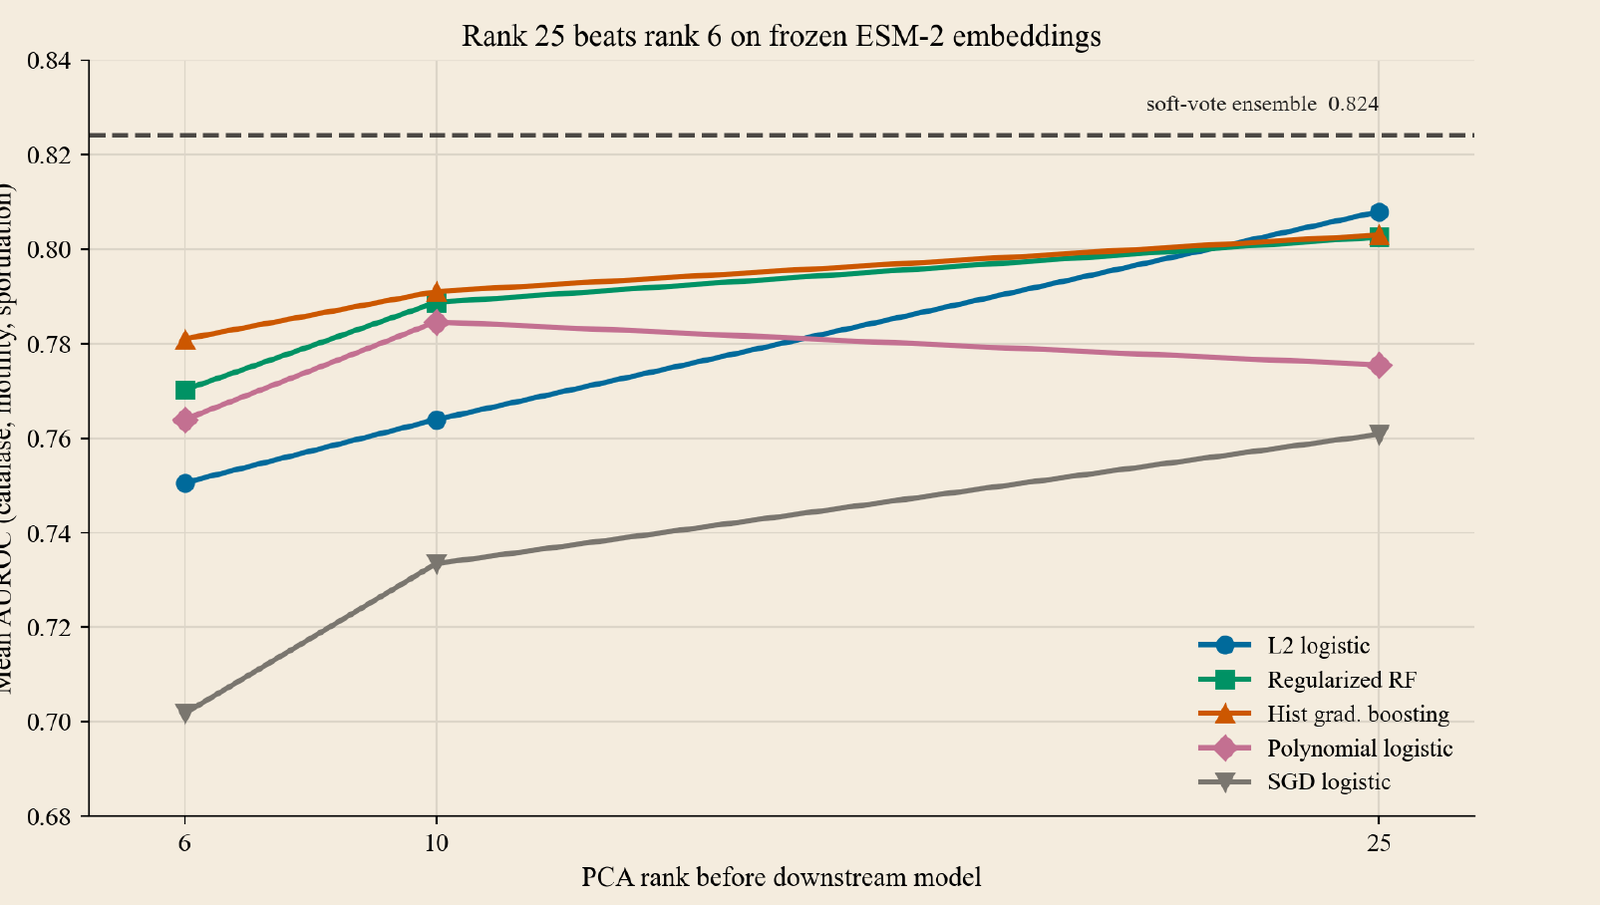
The PCA sweep is the key connection to the low-rank-data critique. If these traits behaved like a six-dimensional perturbation dataset, rank 6 would saturate simple-model performance. It does not. Mean AUROC rises from rank 6 to rank 25 for L2 logistic regression (0.751 → 0.808), regularized random forest (0.770 → 0.803), and histogram gradient boosting (0.781 → 0.803). The useful microbial trait signal is broader than six principal components.
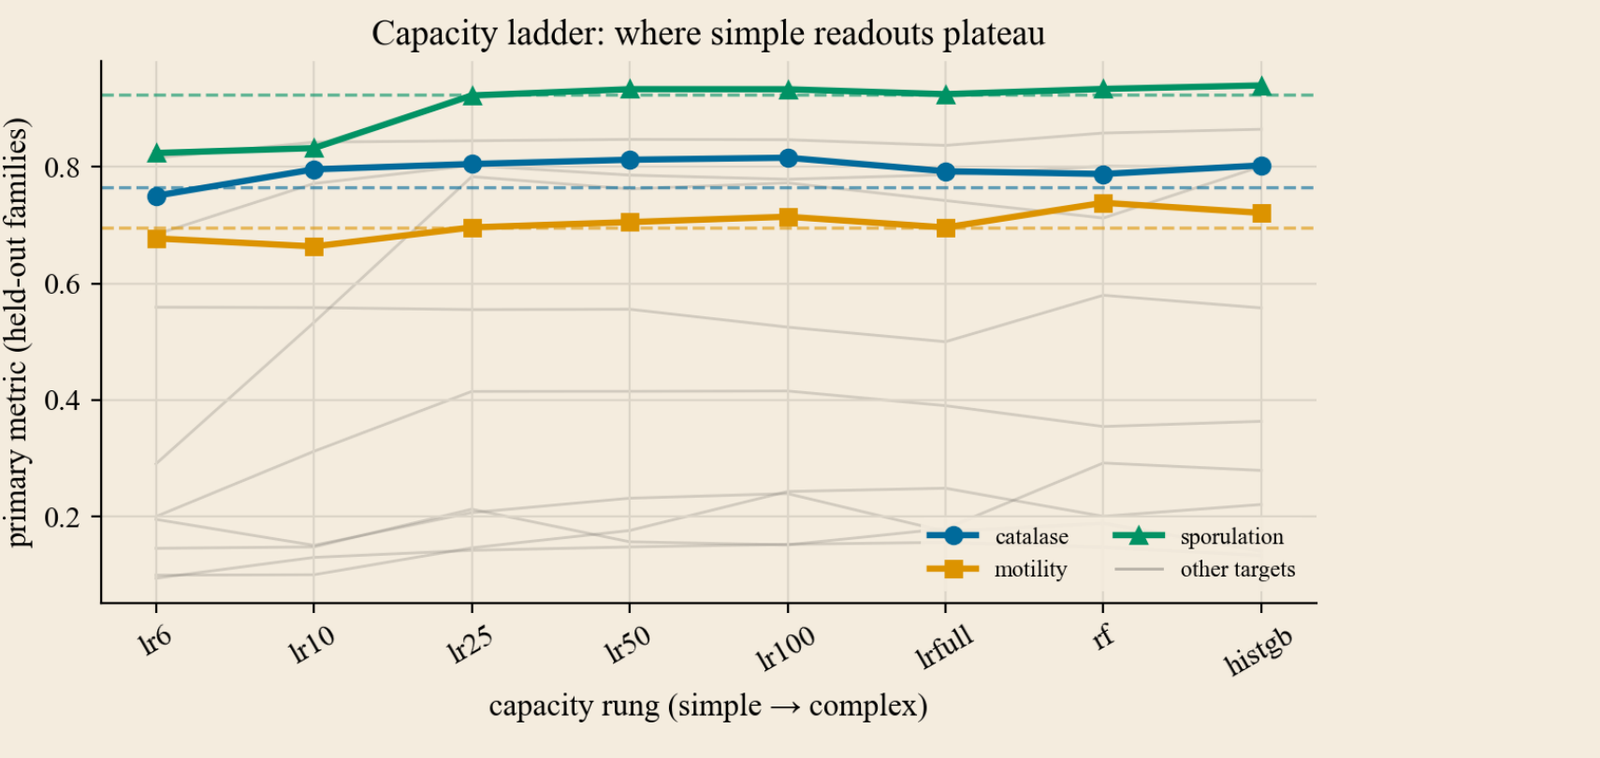
Framed as a capacity ladder (grow the readout while the metric keeps improving, then compare the plateau against an independent cosine-kNN coverage ceiling), the rule returns the same verdict as the rest of the project. Where the ceiling exists, catalase and sporulation plateau at or above it (coverage-limited: a larger model is not indicated), while motility has not yet plateaued (keep scaling the simple family before reaching for anything heavier).
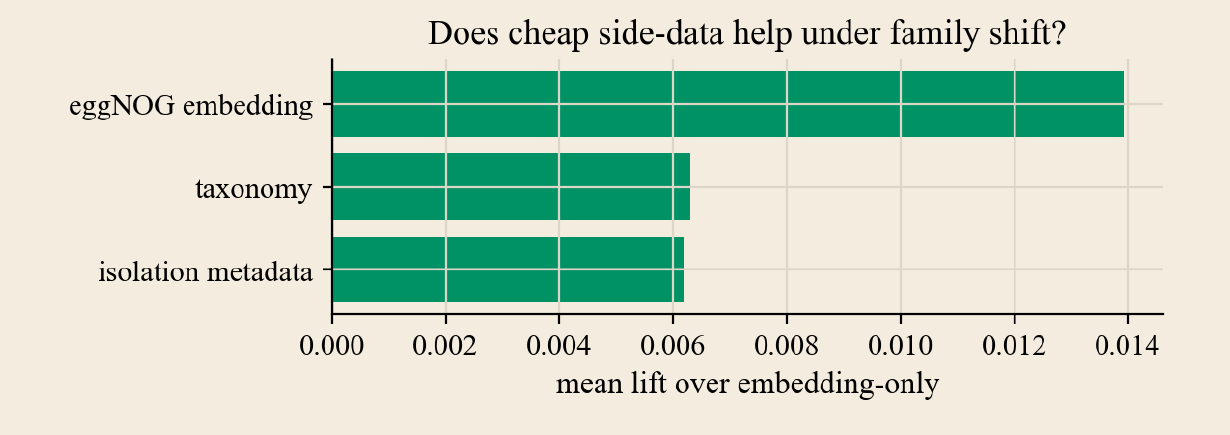
Does cheap side-data help?
A cheaper lever than more model capacity is adding side-data the encoder never saw: coarse taxonomy, sequence-independent isolation metadata, and a second, independently trained embedding (eggNOG functional annotations). Concatenated onto the frozen ESM-2 embedding under the same family-held-out protocol, all three give a positive mean lift, but a small one: the eggNOG embedding adds +0.014, taxonomy and isolation only +0.006 each. And the taxonomy number needs a caveat: its lift lands mostly on clade-confounded targets and turns negative on the pathogenicity traits, so it is partly a proxy for the very clade structure the split holds out, not newly recovered biology.
What it means
The result sharpens, rather than contradicts, our earlier findings. Pooling helped some traits in-distribution but not under family shift; LoRA did not rescue family transfer and created metric artifacts on imbalanced heads. This baseline adds a third point: frozen ESM-2 embeddings already contain substantial microbial trait signal, and simple regularized readouts recover much of it. The failure mode is therefore unlikely to be "the model is not big enough" or "the encoder was not fine-tuned." The more plausible bottlenecks are family-level distribution shift, label sparsity and noise, trait-specific biology, and metric choice.
The practical recipe: freeze the encoder, sweep PCA rank and simple regularized readouts, identify which traits plateau, and only then escalate to attention pooling, LoRA, or a small transformer head for the traits where simple models fail. Because the simple readouts here are competitive models rather than straw men, this is a fair test of whether a heavier encoder is needed at all, and for most traits under family shift it is not.
Keywords: frozen embeddings · protein language models · ESM-2 · baseline regressors · PCA rank · logistic regression · random forest · gradient boosting · genomic trait prediction · distribution shift · BacDive · uncultivated microorganisms
Cite
@article{horiuchi2026frozenbaselines,
  title   = {Knowing When a Bigger Model Helps: A Capacity Ladder for Cross-Family Microbial Trait Prediction},
  author  = {Horiuchi, Miyu},
  year    = {2026},
  note    = {replicater.xyz/writing/frozen-embedding-baselines}
}